Friday, January 18, 2013

Kernel Recompilation in Linux


“Kernel compilation is a tough nut to crack” - Most frequently this would be followed by a sigh if the recompiled kernel is not booting up. Though the nut has the look of a tough one to crack, kernel recompilation is still an inescapable affair that every Linux system administrator runs into, sooner or later. I too had to. With this article, I intend to walk you through the phases of compiling a kernel. I am sure it will inspire confidence in you so that compiling a kernel is no longer a “mission impossible”.

What is a kernel?

Keeping it simple, kernel is the central part of most of the operating systems. The main functions of kernel include process management,resource management etc. It is the first part of operating system that is loaded in to the RAM when the machine is booted and it will remain in the main memory. Since the kernel stays in the main memory, it is important that it should be as small as possible.
In Linux, kernel is a single file called vmlinuz which is stored in the folder /boot, where vm represents virtual memory and z at the end of the filename denotes that it is compressed.

When do we recompile a kernel?

To reduce the size of the kernel:

Suppose you are a Linux fanatic and you need an OS in your mobile. The typical OS you get has the all the miscellaneous components and has size in many MB s, which you can’t afford in your mobile. If I were you, I would do a kernel recompilation, and remove unwanted modules.
When the size of the kernel is reduced removing the unwanted items, less memory will be used which in turn will increase the resource available to applications.

To add or remove support for devices:

For each device, a device driver is needed for communicating with the operating system. For example, if a USB device is attached to a computer, we need to enable the corresponding device driver for it to work. In technical terms, the support for USB driver is to be enabled in the kernel.

To modify system parameters:

System parameters include high memory support, quota support etc. For managing physical memory above 4 GB, high memory support (64 GB) needs to be enabled.

How do we recompile a kernel?

  1. Verify and update the packages required
  2. Obtain kernel source
  3. Obtain current hardware details
  4. Configure kernel
  5. Build kernel
  6. Configure the Boot loader
  7. Reboot the server

1. Verify and update the packages required

You need to do this step only if you upgrade the kernel from version 2.4 to 2.6. You can skip this step if it is a 2.6.x to 2.6.x upgrade.
Before upgrading the kernel, you need to make sure that your system is capable of accepting the new kernel. Check the utilities that interact with your system, and verify that they are up-to-date. If they are not, go ahead and upgrade them first.
The main packages to be checked and upgraded are : binutils, e2fsprogs, procps, gcc and module-init-tools
You should take extreme care while upgrading module-init-tools. A module is a piece of code that can be inserted into the kernel on demand. Module-init-tools provide utilities for managing Linux kernel modules - for loading, unloading,listing and removing modules.
The main utilities available are :
  • insmod
  • rmmod
  • modprobe
  • depmod
  • lsmod
Both modprobe and insmod are used to insert modules. The only difference is that insmod doesn’t know the location of the module and is unaware of dependencies. Modprobe does this by parsing the file /lib/modules//modules.dep
How to install module-init-tools
tar -zxf module-init-tools-3.2.2.tar.gz
2. Configure it.
cd module-init-tools-3.2.2
./configure --prefix=/
3. Rename the existing 2.4 version of this utility as utility.old
make moveold
4. Build and install.
make
make install
5. Run the script generate-modprobe.conf to convert the entries in the module configuration file for kernel version 2.4 ( /etc/modules.conf ) to a file used by kernel version 2.6 (/etc/modprobe.conf)
./generate-modprobe.conf /etc/modprobe.conf
6. Check the version of current module-init-tools
depmod -V

2. Obtain the Kernel Source

You can download the source to the /usr/src/kernels folder in your server. If you are planning to recompile your kernel to version 2.6.19.2, the steps would be :
[root]#cd /usr/src/kernels
[root]#wget http://www.kernel.org/pub/linux/kernel/v2.6/linux-2.6.19.2.tar.gz
[root]#tar zxf linux-2.6.19.2.tar.gz
[root]#cd linux-2.6.19.2

3. Obtain the Current Hardware Details

The current Hardware details can be obtained using the following commands:

lspci

This utility gives the details about the network card and all devices attached to the machine. If you type lspci and get an error “lscpi: command not found”, you will have to install pciutils-2.1.99.test8-3.4 rpm in the server.
A typical lspci output will be as follows :
[root@XXXXX ~]# lspci
00:01.0 PCI bridge: Broadcom BCM5785 [HT1000] PCI/PCI-X Bridge
00:02.0 Host bridge: Broadcom BCM5785 [HT1000] Legacy South Bridge
00:02.1 IDE interface: Broadcom BCM5785 [HT1000] IDE
00:02.2 ISA bridge: Broadcom BCM5785 [HT1000] LPC
00:03.0 USB Controller: Broadcom BCM5785 [HT1000] USB (rev 01)
00:03.1 USB Controller: Broadcom BCM5785 [HT1000] USB (rev 01)
00:03.2 USB Controller: Broadcom BCM5785 [HT1000] USB (rev 01)
00:05.0 VGA compatible controller: ATI Technologies Inc Rage XL (rev 27)
00:18.0 Host bridge: Advanced Micro Devices [AMD]
K8 [Athlon64/Opteron] HyperTransport Technology Configuration
00:18.1 Host bridge: Advanced Micro Devices [AMD]
K8 [Athlon64/Opteron] Address Map
00:18.2 Host bridge: Advanced Micro Devices [AMD]
K8 [Athlon64/Opteron] DRAM Controller
00:18.3 Host bridge: Advanced Micro Devices [AMD]
K8 [Athlon64/Opteron] Miscellaneous Control
01:0d.0 PCI bridge: Broadcom BCM5785 [HT1000]
PCI/PCI-X Bridge (rev b2)
01:0e.0 RAID bus controller: Broadcom BCM5785 [HT1000]
SATA (Native SATA Mode)
02:03.0 Ethernet controller: Broadcom Corporation
NetXtreme BCM5704 Gigabit Ethernet (rev 10)
02:03.1 Ethernet controller: Broadcom Corporation
NetXtreme BCM5704 Gigabit Ethernet (rev 10)
[root@XXXXX ~]#

cat /proc/cpuinfo

The processor details can be obtained from the file /proc/cpuinfo
[root@XXXX ~]# cat /proc/cpuinfo
processor : 0
vendor_id : AuthenticAMD
cpu family : 15
model : 35
model name : Dual Core AMD Opteron(tm) Processor 170
stepping : 2
cpu MHz : 1996.107
cache size : 1024 KB
physical id : 0
siblings : 2
core id : 0
cpu cores : 2
fdiv_bug : no
hlt_bug : no
f00f_bug : no
coma_bug : no
fpu : yes
fpu_exception : yes
cpuid level : 1
wp : yes
flags : fpu vme de pse tsc msr pae mce cx8 apic sep mtrr pge mca
cmov pat pse36 clflush mmx fxsr sse sse2 ht pni syscall nx mmxext fxsr_opt
lm 3dnowext 3dnow pni
bogomips : 3992.34
[root@XXXXX ~]#

modinfo

Another useful tool to obtain hardware information is modinfo. It gives detailed description about modules. Before using modinfo, you may need to find out currently loaded modules. lsmod is the utility that lists currently loaded modules.
[root@XXXXXX ~]# lsmod
libata 105757 1 sata_svw
[root@ XXXXXX~]#
lsmod displays a module sata_svw and more details of this module can be obtained as shown below.
[root@XXXXX ~]# modinfo sata_svw
filename: /lib/modules/2.6.9-55.ELsmp/kernel/drivers/ata/sata_svw.ko
author: Benjamin Herrenschmidt
description: low-level driver for K2 SATA controller
license: GPL
version: 2.0 9FF8518CB6CD3CB4AE61E35
vermagic: 2.6.9-55.ELsmp SMP 686 REGPARM 4KSTACKS gcc-3.4
depends: libata
alias: pci:v00001166d00000240sv*sd*bc*sc*i*
alias: pci:v00001166d00000241sv*sd*bc*sc*i*
alias: pci:v00001166d00000242sv*sd*bc*sc*i*
alias: pci:v00001166d0000024Asv*sd*bc*sc*i*
alias: pci:v00001166d0000024Bsv*sd*bc*sc*i*
[root@xxxxxx~]#

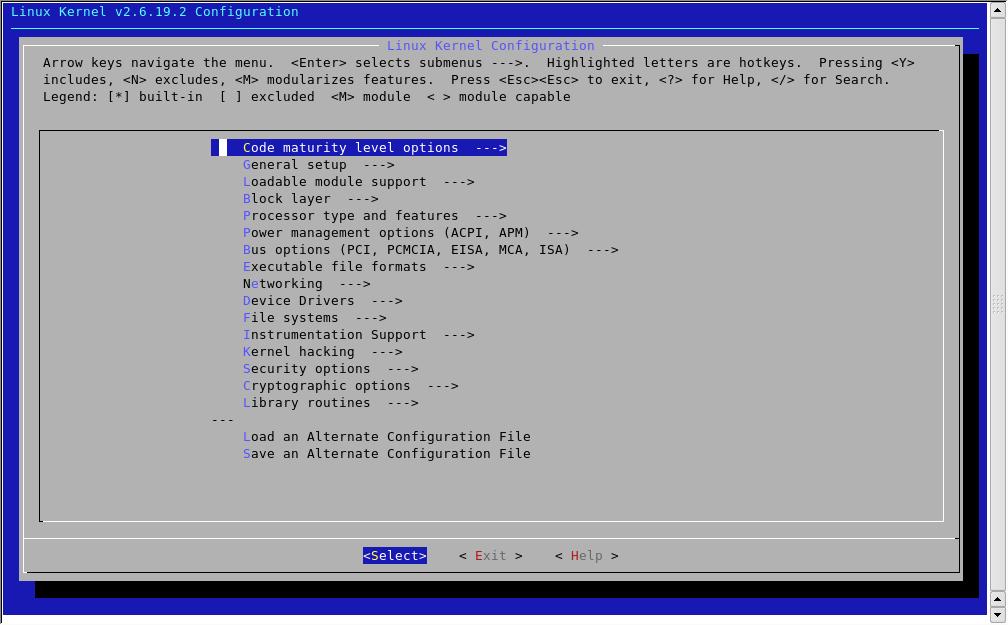
4. Configure the Kernel

Once you have the source, the next step is to configure the kernel.
You can configure the kernel using any of the following :
  1. make config - This is a text based command line interface that will ask each and every configuration question in order.
  2. make xconfig - This is a graphical editor that requires x to be installed in the system. Hence it is not used in servers.
  3. make oldconfig - A text based interface that takes an existing configuration file and queries for any variable not enabled in that configuration file.
  4. make menuconfig - A text based menu configurator based on cursor-control libraries. This is the most commonly used method for configuring kernels in servers.
If you are a newbie, I would recommend using the existing configuration and use make menuconfig to configure the kernel.
Steps for configuring your kernel are :

Step 1: Copy the current kernel configuration to your new kernel source.

[root@XXXXX ~]#pwd
/usr/src/kernels/linux-2.6.19.2
[root@XXXXX ~]#cp /boot/config- .config
[root@XXXXX ~]#make oldconfig
where should be replaced with the existing kernel version in the server. You can get in the server using the command :
[root@XXXXX ~]# uname -r
2.6.9-67.ELsmp2.6.9-67.ELsmp
[root@XXXXX ~]#
When make oldconfig prompts for values, retain the old values.Even if you retain the old values, don’t forget to check the hardware of the server as well as the processor type and the model of the ethernet card. Since options change with newer kernel versions, and some options may not be there in the old .config files, it is advisable to double check all the options using menuconfig.

Step 2: make menuconfig.

[root@XXXXX ~]#make menuconfig
This is the main screen of menuconfig. Only some options can be compiled as modules. In menuconfig, they are marked < >. Press M to compile as a module. A [*] means compiled in, M means module.
menuconfigMenuconfig offers search feature. Use “/” to search for any module. For eg: if you are not sure of the location of the module iptables, press “/” , enter the search pattern as “iptables” and press enter.
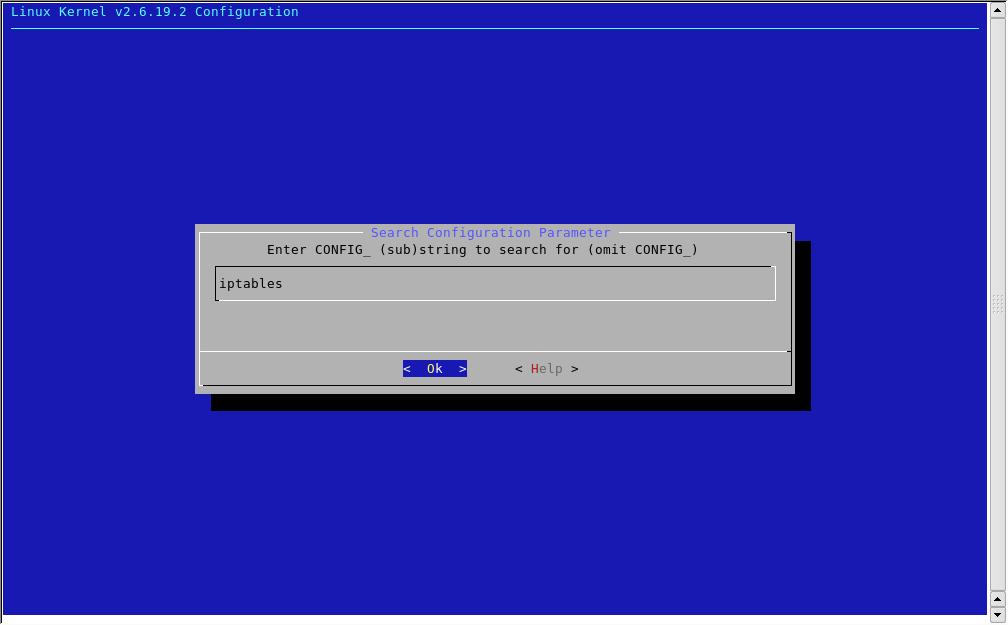
Search for configuration parameter
menuconfig search results
As there are a lot of options in menuconfig, I will just mention the important ones. The essential options needed for a kernel to be running is processor, file system, network card and hard disk. You can select the desired processor, file system, hard disk and network card from the options available in menuconfig.
Processor type and features
Subarchitecture Type : Select Generic architecture (Summit,bigsmp, ES7000, default)
Processor family : Select the matching processor from the available list. For eg : If the model name is Dual Core AMD Opteron(tm) Processor 170 , you can select Opteron/Athlon64/Hammer/K8 from the options available.
For a multiprocessor server, enable the options Symmetric multi-processing support and SMT (Hyper threading) scheduler support.
For RAM > 4 GB enable the option High Memory Support (64GB) . And the final output of the option Processor type and features would look like this :
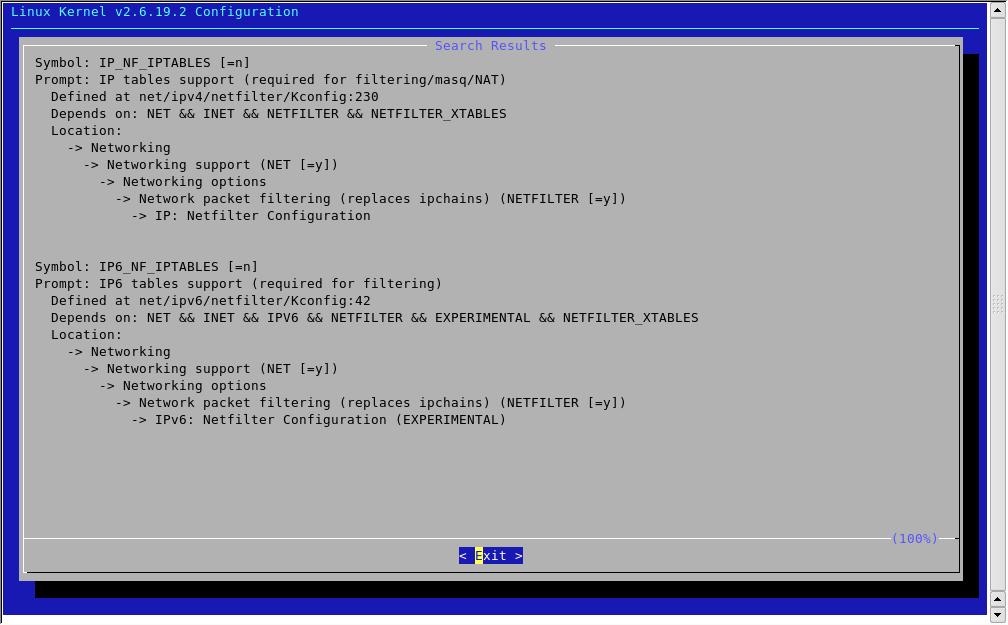
menuconfig processor type
Networking
Iptables is enabled in this option.
Location:
 -> Networking
   -> Networking support (NET [=y])
     -> Networking options
       -> Network packet filtering (replaces ipchains) (NETFILTER [=y])
         -> Core Netfilter Configuration and IP: Netfilter Configuration
All the modules under the option Core Netfilter Configuration and IP: Netfilter Configuration should be enabled as modules.
Device Drivers
This is the most confusing part. In this, the main options you need to check are :
1. Block devices : Enable RAM disk support and Loop back device support
Include Loopback device support (module)
RAM disk support [*} compiled in
Leave the default values of RAM disk number and size.
Initial RAM disk (initrd) support [*} compiled in
2. SCSI device support : Enable corresponding model in SCSI low level drivers if it is a SCSI device.
3. Serial ATA (prod) and Parallel ATA (experimental) drivers: if hard disk is SATA, enable the corresponding driver in this. For eg: if you have Intel PIIX/ICH SATA in the server enable Intel PIIX/ICH SATA support in this option
4. Network device support : Enable the corresponding network card in the server. For eg: if lspci lists the network card as follows :
Ethernet controller: Broadcom Corporation NetXtreme BCM5704 Gigabit Ethernet

Then enable 

 > Network device support
   > Ethernet (1000 Mbit)ss
     > Broadcom NetXtremeII support
File Systems
The main modules to be enabled in this section are ext2, ext3, journaling and Quota support.
Once this is complete , save the settings and quit.

5. Build the Kernel

The next step is to build the Kernel. You can use the command make bzImage to do this. This command will create a compressed file bzImageinside arch/i386/boot in the Linux source directory and that is the newly compiled kernel.
The next step is to compile and link the modules. This can be done using the command make modules.
After this you have to copy the modules to /lib/modules/. And this is done using the command make modules_install.
The command sequence is as follows :
make -j bzImage
make -j modules
make -j modules-Install
-j tells your system to do that many jobs in Makefile together which will in turn reduce the time for compilation.
is two times the number of cpus in your system or number of virtual processors. This number can be found using the command
cat /proc/cpuinfo | grep ^processor | wc -l
[root@XXXX]# cat /proc/cpuinfo | grep ^processor | wc -l
2
Once this is done copy all these to the /boot folder as follows :
cp .config /boot/config-2.6.19.2
cp arch/i386/boot/bzImage /boot/vmlinuz-2.6.19.2
cp System.map /boot/System.map-2.6.19.2
mkinitrd /boot/initrd-2.6.9.img 2.6.19.2
mkinitrd is the program to create initial RAM Disk Image.

6. Configure Boot Loader

Boot loader is the first program that runs when a computer boots. There are two types of boot loader :
  • GRUB
  • LILO

1. Determine the currently installed boot loader :

Check first 512 bytes of the boot drive. Check for grub first:
# dd if=/dev/hda bs=512 count=1 2>&1 | grep GRUB
If it matches, the current boot loader is grub. Check for lilo if it did not match:
# dd if=/dev/hda bs=512 count=1 2>&1 | grep LILO
Note : If the hard disk is SCSI or SATA, use sda instead of hda..

2. Configure the boot loader

If your boot loader is LILO, add entries for the new kernel in the file/etc/lilo.conf. A typical lilo entry will be as given below :
image=/boot/vmlinuz-2.6.19.2
 label=linux
 initrd=/boot/initrd-2.6.19.2.img
 read-only
 append="console=tty0 console=ttyS1,19200n8 clock=pmtmr root=LABEL=/"
Run the command :
lilo -v
/sbin/lilo -R "Label for new kernel"
In the case of GRUB, add the entries for the new kernel at the end of the list of kernels in the file /etc/grub.conf. The first entry in GRUB gets the index 0. An example entry is below :
title Red Hat Linux (2.6.19.2)
root (hd0,0)
kernel /boot/vmlinuz-2.6.19.2 ro root=/dev/hda2 panic=3
initrd /boot/initrd-2.6.19.2
The “panic” parameter ensures that the server reboots to the old kernel, in the case of a kernel panic i.e the machine will be rebooted to the default option in grub.conf, if a panic occurs in 3 secs.
Do Not change the “default” value in the file grub.conf. Enter grub command prompt by typing the command grub at the prompt. Enter the below command at the grub prompt:
savedefault --default=3 --once
This is the case if the newly added entry is having index 3. Exit from grub-shell.

7.Reboot the Server

Reboot the server using the command reboot. If by any chance, a kernel panic occurs, server will be up with the old working kernel. If everything goes fine, the server will be up with the new kernel. Once it is up with the new kernel, do not forget to change the default value in the boot loader.

Conclusion

Booting a newly recompiled kernel in your first attempt is a tough task and is at times thought impossible. Following the above steps and keeping the compilation tricks in mind, there is no doubt Kernel Compilation will now be a piece of cake.

SAN (Storage area Networking) for System Administrators


In conventional IT systems, storage devices are connected to servers bymeans of SCSI cables. The idea behind storage networks is that these SCSI cables arereplaced by a network, which is installed in addition to the existing LAN. Server and storage devices can exchange data over this new network using the SCSI protocol

SAN Components


1. Server Hardware – The actual machines which are configured to use the data from the storage devices. The major vendors for Server hardware are ORACLE ( formerly SUN Microsystems) , IBM, HP, Fujitsu ..etc.
2. Storage Hardware – The actual Disk arrays from smaller size to enterprise size. The major Vendors for Storage Hardware are EMC, Oracle (formerly knows as SUN Microsystems), IBM, HP , DELL …etc.
3. HBA – Host Bus adapters acts as initiator in SCSI storage subsystem and main function is converting SCSI commands into Fiber Channel format and establish connection from server side to the SAN. You can compare HBA cards with Ethernet adapters in our regular networking. Major vendors are SUN, Emulex, Qlogic, JNI ..etc.
4. SAN Switches – These are similar to Ethernet switches , but do switching for fiber networks. Major vendors are Brocade, Cisco ….etc.

SAN Topology

In this exercise, we will be looking at various phases of SAN configuration and practically looking at the configuration of two Solaris machines with Emulex HBAs connected to a EMC Clarion Storage.
From the diagram you can notice two Solaris servers named “gurkul1 and gurkul2″, two SAN switches named “SN1 and SN2″ and EMC device with two Storage arrays “array1 and array2″.
The SAN Switch and the Storage array together comprises a fabric in the SAN.

PORTS

In regular networking we do have ports in Ethernet adapters to interconnect the networking devices using network cables, in the similar way in Storage Area Networking we do have different types of ports which are used to interconnect Servers , Switches and Storage. Below are the common type of ports that we commonly discuss while talking about SAN.
  • ‘N’ port: Node ports used for connecting peripheral storage devices to switch fabric or for point to point configurations
  • ‘F’ port: Fabric ports reside on switches and allow connection of storage peripherals (‘N’ port devices)
  • ‘E’ port: Expansion ports are essentially trunk ports used to connect two Fibre Channel switches
  • ‘G’ port: A generic port capable of operating as either an ‘E’ or ‘F’ port. Its also capable of acting in an ‘L’ port capacity— known as a ‘G’ port
  • ‘L’ port: Loop ports are used in arbitrated loop configurations to build storage peripheral networks without FC switches. These ports often also have ‘N’ port capabilities and are called ‘NL’ ports
Important point to remember here is End to end connection managed by N ports, and Switching and addressing handled by fabric Ports.

SAN Device Identification

World-wide name (WWN): Similar to an Ethernet address in the traditional networking world, this is a unique name assigned by the manufacturer to the HBA. This name is then used to grant and restrict access to other components of the SAN. There are two basic forms of WWN.
1. World Wide Node Name (WWNN)—Assigned to Fibre Channel node device by vendor
2. World Wide Port Name (WWPN) —Assigned to Fibre Channel Host BusAdapter port by vendor
Normally that the HBA vendor will provide a tool that allows the system administrator to query the wwn of the HBA (e.g. Emulex supplies the lputil application). The world-wide name of the symmetrix fibre adapters (FA) can be obtained from EMC, and inaddition to the WWPN for EMC we should also note the SCSI target ID assigned for specific FA in order to make configuration in Solaris Side.
For host bus adapters, the world wide name is typically displayed in the /var/adm/messages file after the fibre card and software driver have been installed. An example of for an Emulex PCI fibre HBA is as follows. In this case, the relevant value the WWPN, the World-Wide Port Name.
May 18 09:26:28 gurkul1 lpfc: [ID 242157 kern.info] NOTICE:
lpfc0:031:Link Up Event received Data: 1 1 0 0
May 18 09:26:31 gurkul1 lpfc: [ID 129691 kern.notice] NOTICE:
lpfc0: Firmware Rev 3.20 (D2D3.20X3)
May 18 09:26:31 gurkul1 lpfc: [ID 664688 kern.notice] NOTICE:
lpfc0: WWPN:11:11:11:11:11:11:11:01
WWNN:20:22:22:22:22:22:22:22 DID 0×210913
May 18 09:26:31 gurkul1 lpfc: [ID 494464 kern.info] NOTICE:
lpfc1:031:Link Up Event received Data: 1 1 0 0
May 18 09:26:34 gurkul1 lpfc: [ID 129691 kern.notice] NOTICE:
lpfc1: Firmware Rev 3.20 (D2D3.20X3)
May 18 09:26:34 gurkul1 lpfc: [ID 664688 kern.notice] NOTICE:
lpfc1: WWPN:11:11:1111:11:11:11:02
WWNN:20:22:22:22:22:22:22:02 DID 0×210913
For the purpose of our configuration example I am adding the list of WWPNs numbers that we are going to use here ( we should collect this information before configuring the Server/Storage)
Host name port SCSI target World Wide Name
Gurkul1 Hba1
1111111111111101
Gurkul1 Hba2
1111111111111102
Gurkul2 Hba1
2121212121212101
Gurkul2 Hba2
2121212121212102
EMC Fa1a target 11 555555555555551a
EMC Fa1b target 12 555555555555551b
EMC FA2a target 21 555555555555552a
EMC Fa2b target 22 555555555555552b


SAN Connections
The below diagram illustrates several principals common to most san topologies:
  • There are two separate switched (“SN1″ and “SN2″). Each switch therefore comprises an independent “fabric”.
  • The array provides multiple I/O paths to every disk device. In the diagram beside, for example, the disk device “Disk01″ is accessible via both FA1A and FA1B. Depending on the array, the two paths may be simultaneously active (active/active) or only one path may be valid at a time (active/passive).
  • Each host has a connection into each fabric. Host-based software load-balances the traffic between the two links if the array supports active/active disk access. Furthermore, the host should adjust to a single link failure by rerouting all traffic along the surviving path.

Storage PATH for Gurkul1 Server
Take a moment to examine the diagram below and consider the host “gurkul1″. Assuming that it requires highly-available access to disk Disk02 in Array2 , note that there are two separate paths to that device.
Path1 : HBA1–> SN1 (P1) –> SN1 (P5) –> FA1B –> Array2 –> Disk02
Path2 : HBA2–> SN2 (P1) –> SN2 (P5) –> FA2B –> Array2 –> Disk02

Storage PATH for Gurkul2 Server

Similar way to Gurkul1 now we can examine the diagram beside to identify the storage paths available for ”gurkul2″. Assuming that it requires highly-available access to disk Disk01 in Array1 . And again here we have total separate paths to that device.
Path1 : HBA1 –> SN1 (P3) –> SN1 (P4) –> FA2A –> Array1 –> Disk01
Path2 : HBA2 –> SN2 (P3) –> SN2 (P4) –> FA1A –> Array1 –> Disk01

Target configuration that we want to configure

  • For gurkul1: need access to the LUN02 (Disk02 ) to LUN05 (Disk05) from the storage array2, through FA1B and FA2B
  • For gurkul2: need access to the LUN01 (Disk01) to LUN04( Disk04) from the storage array1, through FA1A and FA2A
  • And both servers require access to disk00 – lun00 on each adapter they are connected

Solaris 8/9 host side configuration

Typically, there are two configuration files that need to be updated once the vendor’s hba software has been installed. The hba driver’s configuration file typically resides in the /kernel/drv directory, and must be updated to support persistent binding and any other configuration requirements specified by the array vendor. Secondly, the Solaris “sd” driver configuration file sd.conf must be updated to tell the operating system to scan for more than the default list of scsi disk devices. The examples below describe the process for configuring Emulex cards in to support an EMC Symmetrix array.

1. Configuring /kernel/drv/lpfc.conf

A. To configure Gurkul1 Server with below storage paths
Path1 : HBA1 (lpfc0) –> SN1 (P1) –> SN1 (P5) –> FA1B ( target 12 )–> Array2 –> Disk02
Path2 : HBA2 (lpfc1) –> SN2 (P1) –> SN2 (P5) –> FA2B ( target 22) –> Array2 –> Disk02
We Have to update below entries in /kernel/drv/lpfc.conf
fcp-bind-WWPN=”555555555555551B:lpfc0t12″,
“555555555555552B:lpfc1t22″;
B.To configure Gurkul2 Server with below storage paths
Path1 : HBA1(lpfc0) –> SN1 (P3) –> SN1 (P4) –> FA2A ( target 11) –> Array1 –> Disk01
Path2 : HBA2 (lpfc1) –> SN2 (P3) –> SN2 (P4) –> FA1A (target 21) –> Array1 –> Disk01
We have to update below entries in /kernel/drv/lpfc.conf
fcp-bind-WWPN=”555555555555551A:lpfc0t11″,
“555555555555552A:lpfc1t21″;
2. Configuring /kernel/drv/sd.conf

By default, the Solaris server will scan for a limited number of scsi devices. The administrator has to update the/kernel/drv/sd.conf file to tell the sd driver to scan for a broader range of scsi devices. In both cases, the target number associated with the WWPN of the fiber array adapter is arbitrary. In our case, we’ve assigned scsi targets 11, 12, 21, and 22 to the four array adapters. The following list describes the additions to the /kernel/drv/sd.conf file for each of the three hosts:


A. Gurkul1 Server:
# Entries added for host gurkul1 to “see” lun ( 0,2,3,4,5 ) on FA1B and FA2B with target 12 and 22
# FA1B = 555555555555551B
name=”sd” target=12 lun=0 hba=”lpfc0″ wwn=”555555555555551B”;
name=”sd” target=12 lun=2 hba=”lpfc0″ wwn=”555555555555551B”;
name=”sd” target=12 lun=3 hba=”lpfc0″ wwn=”555555555555551B”;
name=”sd” target=12 lun=4 hba=”lpfc0″ wwn=”555555555555551B”;
name=”sd” target=12 lun=5 hba=”lpfc0″ wwn=”555555555555551B”;
# FA2Bb = 555555555555552B
name=”sd” target=22 lun=0 hba=”lpfc1″ wwn=”555555555555552B”;
name=”sd” target=22 lun=2 hba=”lpfc1″ wwn=”555555555555552B”;
name=”sd” target=22 lun=3 hba=”lpfc1″ wwn=”555555555555552B”;
name=”sd” target=22 lun=4 hba=”lpfc1″ wwn=”555555555555552B”;
name=”sd” target=22 lun=5 hba=”lpfc1″ wwn=”555555555555552B”;
B. Gurkul2 Server:
# Entries added for host gurkul1 to “see” lun(0,1,2,3,4) on FA1A and FA2A with target 11 and 21
# FA1B = 555555555555551A
name=”sd” target=12 lun=0 hba=”lpfc0″ wwn=”555555555555551A”;
name=”sd” target=12 lun=1 hba=”lpfc0″ wwn=”555555555555551A”;
name=”sd” target=12 lun=2 hba=”lpfc0″ wwn=”555555555555551A”;
name=”sd” target=12 lun=3 hba=”lpfc0″ wwn=”555555555555551A”;
name=”sd” target=12 lun=4 hba=”lpfc0″ wwn=”555555555555551A”;
# FA2Bb = 555555555555552A
name=”sd” target=22 lun=0 hba=”lpfc1″ wwn=”555555555555552A”;
name=”sd” target=22 lun=1 hba=”lpfc1″ wwn=”555555555555552A”;
name=”sd” target=22 lun=2 hba=”lpfc1″ wwn=”555555555555552A”;
name=”sd” target=22 lun=3 hba=”lpfc1″ wwn=”555555555555552A”;
name=”sd” target=22 lun=4 hba=”lpfc1″ wwn=”555555555555552A”;

3. Update the /etc/system file as per EMC’s requirements for the Symmetrix.
 

set sd:sd_max_throttle=20
set scsi_options = 0x7F8
* Powerpath? Enter
* No sd:sd_io_time=0×78
* Yes sd:sd_io_time=0x3C
set sd:sd_io_time=0x3C
4. Perform the Final Reconfiguration Reboot
Perform a reconfiguration reboot (e.g. “reboot — -r”) on all three servers.
And after the reboot see the outout for
#format
You should see the desired disks. Put a Sun label on them via the “format” command and the configuration is complete.

Wednesday, January 9, 2013

VMware vSphere 5–Using Image Builder For Custom Installation

Hard to believe the vSphere 5 release is coming down the pipe. In anticipation of the official availability of the bits for use and VMworld 2011, I thought it would be a great idea for everyone to get their house in order and prep for deploying vSphere 5.
One of the cool new features with the vSphere 5 release was the inclusion of new PowerCLI functions called Image Builder.
Image Builder allows VMware Admins to customize their installation media by adding and removing components. These components, called VMware Infrastructure Bundles (VIBs), comprise the base image, drivers, CIM providers, and other necessary components to make the vSphere go-‘round. Plus, 3rd party vendors can release VIBs in the future for new devices, providers, or whatever (can someone make a Minesweeper VIB?). This results in:
  1. VMware not needing to keep updating just to add code for new devices.
  2. VMware Admins no longer need to kludge through cramming the driver support for 3rd party products using Linux-based utilities and concepts (although, good job for knowing how to do it)
  3. VMware Admins can create a single custom installation with the appropriate drivers without having to install ESXi on a host and immediately patch to add the components.
As mentioned above, Image Builder is included with the latest and greatest version of the PowerCLI utilities… well… the latest and greatest vSphere 5 PowerCLI utilities. So, don’t rush out and download right now.
Note: When installing the new PowerCLI for vSphere 5 over an existing PowerCLI installation, you may find that the Image Builder cmdlets do not appear to be available. If this is the case, be sure to uninstall ALL PowerCLI installations on your workstation prior to installing the new PowerCLI. I ran into this problem during the installation of the pre-release bits and it drove me crazy. Heck, why not just uninstall first to be on the safe side?!
Image Builder introduces two new terms to our VMware verbiage
  1. VIB – (as mentioned above) bundles of files that can comprise any base image, driver, CIM provider, or another component. VIBs are certified by VMware and fit a very specific format.
  2. Depot – A location where Image Builder can find installation components (aka – an offline bundle). An offline bundle is just a .zip file containing the installation files for a specific version of ESXi. These can be downloaded from the vSphere download page (typically, you are provided with the option of a .iso or .zip download of the media – the .zip is the offline bundle/depot). However, a depot can also be a URL to an offline bundle!!! During Image Builder sessions, multiple depots can be added to a session.
  3. Profile – A profile is the entity that comprises the image you are working with. Offline Bundles contain multiple profiles that can be used as a basis to copy. The profile, essentially, tells Image Builder which components to pack into a custom installation.
    Finally, Image Builder understands that creating a custom image does not just involve adding and removing VIBs. Rather, you also need some way to get the custom image out in a usable format. Image Builder allows for the export of the custom image to an offline bundle (.zip) or a usable CD/DVD image (.iso). The offline bundle
So, now that we know what Image Builder does and some new terminology, let’s get down and dirty with creating a new Image Builder custom installation!
Procedure
  • Start up PowerCLI
image
  • Connect to a depot
    • This example will use a locally saved .zip file.
    • Command: Add-EsxSoftwareDepot –DepotUrl C:\Downloads\VMware\Depot\vmware-ESXi-5.0.0-381646-depot.zip
image
  • The offline bundle contains a number of profiles. These profiles are read-only and cannot be edited. However, that does not mean that it cannot be copied to a new profile and customize the copied profile!
  • Get a list of the available depot profiles:
    • Command: Get-EsxImageProfile
    image
    • As you can see, we have two profiles: ESXi5.0.0-381646-no-tools and standard.
  • Create a copy of a profile
    • Command: New-EsxImageProfile –CloneProfile ESXi-5.0.0-381646-standard –Name “Custom_vSphere5_Installation”
image
  • Now that the profile has been copied, it is time to wreckcreate a new custom installation. First, let’s check on which components are included in the Depot added earlier.
    • Command: Get-ESXSoftwarePackage
    image
    • Note: This will load all software packages for all depots loaded in the session.
    • Each of the packages listed are VIBs! (NEAT!!!)
  • At this point, the question becomes: What is it about the default installation that you do not like? Are you missing some drivers/VIBs? In most instances, you are going to be missing some VIBs. However, there may be a need to remove a VIB for some reason. In the next step, we will be removing a VIB from the custom profile.
    • Note: You are the master of your universe. This example only shows you how to do something. I do not suggest you removing the VIB from the custom profile unless you know you need to. If you remove the VIB and screw up your environment, you only have yourself to blame because you are the master (right?!).
    • Note:The availability of 3rd party VIBs prior to vSphere 5 release is provided by the 3rd parties themselves. I do not have a connection to a 3rd party that could provide a VIB (wamp wamp wamp). So, I will include the command to add one. Once a VIB is available to me, I will update the post.
    • Command (Add a VIB): Add-EsxSoftwarePackage –ImageProfile Custom_vSphere5_Installation
    • Command (Remove a VIB): Remove-EsxSoftwarePackage -ImageProfile
      Custom_vSphere5_Installation -SoftwarePackage sata-sata-promise
image
  • Alright, we have a depot, copied an existing ImageProfile, and messed with the clone so it looks like we want it to. Now, we need to get the profile in some form that we can do something with. How about exporting it?! Fantastic idea. Let’s do it!
  • The customized profiles need to be exported in a format that can be used for installation. Otherwise, you just wasted precious time and bandwidth on something that just dead-ended. Recall that we have 2 options for exporting:
    • ISO – Traditional disk image. These are burned onto CD/DVD media and ESXi can be installed.
    • ZIP – These can be stored on network locations and used for PXE installations, VUM upgrades, and a basis for future Image Builder customizations.
  • Exporting as a .ZIP or .ISO is as simple as changing a value and extension in the PowerCLI command:
    • Command (ISO): Export-EsxImageProfile –ImageProfile Custom_vSphere5_Installation –FilePath C:\downloads\vmware\depot\Custom_vSphere5_Installation.isoExportToIso
    • Command (ZIP): Export-EsxImageProfile –ImageProfile Custom_vSphere5_Installation –FilePath C:\downloads\vmware\depot\Custom_vSphere5_Installation.zipExportToBundle
image
  • Recall that earlier, we wanted to remove the ‘sata-sata-promise’ VIB from our customized installation media? (I would suggest going back a little bit in the post to refresh your memory). This is a great time to make sure it was removed.
    • Browse to the .zip location in Windows Explorer and open the .zip file.image
    • Browse to the ‘vib20’ directory.
image
    • Look around for ‘sata-sata-promise’ VIB. Can you find it?
image
    • Nope! It’s not there! Talk about customization!
At this point, you have viable installation media to streamline your installations and save you time and headaches.
Thanks VMware for the awesome utility. Happy customizations

Changing DNS client property in Solaris 11

1. Backup /etc/resolv.conf
2. Backup the DNS client info using the below command:
 
    svccfg -s network/dns/client listprop config >> /var/tmp/dns.client.info.01072013
3. Run the below command to change the DNS servers:
svccfg -s network/dns/client setprop config/nameserver = net_address: "(PrimaryDNS-IP SecondaryDNS IP)"
4. Refresh the DNS client service:

nscfg export svc:/network/dns/client:default
svcadm refresh name-service/switch
5. Verify by listing the DNS client properties
    svccfg -s network/dns/client listprop config
6. Verify by looking at /etc/resolv.conf
    cat /etc/resolv.conf
7. Verify by lookup for a server
   Eg:
     nslookup HOST

SAN Performance Metrics


SAN Performance Metrics
 

I often get requests from application owners to review performance stats. I thought I’d give a quick overview of some of the things I look at, what the myriad of performance metrics in Navisphere Analyzer and ECC Performance Manager mean, and how you might use some of them to investigate a performance problem. Performance analysis is very much an art (not a science) and it’s sometimes difficult to pinpoint exact causes based on the mix of applications and workload on the array. Taking all of the metrics into account with a holistic view is needed to be successful. Performing data collection of application workloads over time is recommended because application workload characteristics will likely vary over time. If you have a major problem, I would always recommend opening an SR with EMC.

This post is just an overview of SAN performance metrics and isn’t meant to dive in to every possible scenario from every angle. EMC already has excellent guides for performance best practices that you can read here:


·         http://www.scribd.com/doc/91233385/h8268-VNX-Block-Best-Practices (Newer version for VNX)

Because we have EMC’s Performance Manager tool installed in our environment, I always go to that tool first rather than Navisphere Analyzer. Both use the same metrics, so the following information will be useful regardless of which method you use.

The first thing I do is look at the Storage Processors. This will give you a good indication of the overall health of the array before you dive into the specific LUN (or LUNs) used by the application.

·         SP Cache Dirty Pages (%). These are pages in write cache that have received new data from hosts but have not yet been flushed to disk. You should have a high percentage of dirty pages as it increases the chance of a read coming from cache or additional writes to the same block of data being absorbed by the cache. If an IO is served from cache the performance is better than if the data had to be retrieved from disk. That’s why the default watermarks are usually around 60/80% or 70/90%. You don’t want dirty pages to reach 100%, they should fluctuate between the high and low watermarks (which means the Cache is healthy). Periodic spikes or drops outside the watermarks are ok, but consistently hitting 100% indicates that the write cache is overstressed.

·         SP Utilization (%). Check and see if either SP is running higher than about 75%. If either is running that high application response time will be increased. Also, both will need to be under 50% for non-disruptive upgrades. We had to do a large scale migration of data from one SAN to another at one point in order to get a NDU accomplished. You’ll also want to check for proper balance. If one is much higher than the other, you should consider migrating LUNs from one SP owner to another. I check SP balance on all of our arrays on a daily basis.

·         SP Response time (ms). Make sure again that both SPs are even and that response time is acceptable. I like to see response times under 10ms. If you see that one SP has high utilization and response time but the other SP doesn’t, look for LUNs owned by the busier SP that are using more array resources. Looking at total IO on a per LUN basis can help confirm If both SPs have relatively similar throughput but one SP has much higher bandwidth. That could mean that there is some large block IO occurring.

·         SP Port Queue Full Count. This represents the number of times that a front end port issued a QFULL response back to the hosts. If you are seeing QFULL’s it could mean that the Queue Depth on the HBA is too large for the LUNs being accessed. A Clariion/VNX front end port has a queue depth of 1600 which is the maximum number of simultaneous IO’s that port can process. Each LUN on the array has a maximum queue depth that is calculated using a formula based on the number of data disks in the RAID Group. For example, a port with 512 queues and a typical LUN queue depth of 32 can support up to: 512 / 32 = 16 LUNs on 1 Initiator (HBA) or 16 Initiators (HBAs) with 1 LUN each or any combination not to exceed this number. Configurations that exceed this number are in danger of returning QFULL conditions. A QFULL condition signals that the target/storage port is unable to process more IO requests and thus the initiator will need to throttle IO to the storage port. As a result of this, application response times will increase and IO activity will decrease.

The next thing I do is look at the specific LUNs that the application owner is asking about. The list below includes the basic performance metrics that I most often look at when investigating a performance problem.

·         Utilization (%) represents the fraction of an observation period during which a LUN has any outstanding requests. When the LUN becomes the bottleneck, the utilization will be at or close to 100%. However, since I/Os can get serviced by multiple disks an increase in workload might still result in a higher throughput. Utilization by itself is not a very good indicator of the overall performance of the LUN, it needs to be factored in with several other things. For example, If you are writing to a LUN (100% Writes) and the location of the data is in a small physical space on the LUN, it may be possible to get to 100% with write cache re-hits. This means that all writes are being serviced by the write cache and since you are writing data to the same locations over and over you do not flush any of the data to the disks. This can cause your LUN Utilization to be 100% but there will actually be no IO to the disks. Utilization is very affected by caching, both read and write. The LUN can be very busy but may not have a problem. Use Utilization to assist in identifing busy LUNs then look at queuing and response times to see if there really is an issue.

·         Queue Length is the average number of requests within a polling interval that are outstanding to this LUN. A queue length of zero indicates an idle LUN. If three requests arrive at an idle LUN at the same time, only one of them can be served immediately; the other two must wait in the queue. That scenario would result in a queue length of 3. My general guideline for “bad performance” on a LUN is a queue length greater than 2 for a single disk drive.

·         Average Busy Queue Length is the average number of outstanding requests when the LUN was busy. This does not include any idle time. This value should not exceed 2 times the number of spindles on a LUN. For example, if a LUN has 25 spindles, a value of 50 is acceptable. Since this queue length is counted only when the LUN is not idle, the value indicates the frequency variation (burst frequency) of incoming requests. The higher the value, the bigger the burst and the longer the average response time at this component. In contrast to this metric, the average queue length does also include idle periods when no requests are pending. If you have 50% of the time just one outstanding request, and the other 50% the LUN is idle, the average busy queue length will be 1. The average queue length however, will be ½.

·         Response Time (ms) is the average time, in milliseconds, that a request to this LUN is outstanding, including its waiting time. The higher the queue length for a LUN, the more requests are waiting in its queue, thus increasing the average response time of a single request. For a given workload, queue length and response time are directly proportional. Keep in mind that cache re-hits bring down the average response time (and service times), whether they are reads or writes. LUN Response time is a good starting point for troubleshooting. It gives a good indicator of what the host system is experiencing. Usually if your LUN response time (Response time = queue length * service time) is good then the host performance is good. High response times don’t always mean that the CLARiiON is busy, it can also indicate that you’re having issues with your host or Fabric. We use the Brocade Health report on a regular basis to identify hosts that have an excessive amount of traffic, as well as running the EMC HEAT report on hosts that have reported issues (which can identify incorrect HBA Drivers, Bad HBA, etc).These are my general guidelines for response time:
Less than 10 ms: very good
Between 10 – 20 ms: okay
Between 20 – 50 ms: slow, needs attention
Greater than 50 ms: I/O bottleneck

·         Service Time (ms) represents the Time, in milliseconds, a request spent being serviced by a component. It does not include time waiting in a queue. Service time is mainly a characteristic of the system component. However, larger I/Os take longer and therefore usually result in lower throughput (IO/s) but better bandwidth (Mbytes/s). In general, Service time is simply the time it takes to actually send the I/O request to the storage and get an answer back. In general, I like to see service times below 20ms.

·         Total Throughput (IO/sec) is the average number of host requests that is passed through the LUN per second. This includes both read and write requests. Smaller requests usually result in a higher total throughput than larger requests. Examining total throughput (along with %Utilization) is a good way to identify the busiest LUNs on the array. In general, here are the IOPs limits by drive type:

RPM        Drive Type      IOPs
7,200      SATA,NL-SAS     ~80
10,000     SATA,NL-SAS     ~130
10,000     FC,SAS          ~140
15,000     FC,SAS          ~180
N/A        EFD             ~1500 (Read/Write, 60/40)
N/A        EFD             ~6000 (Read)
N/A        EFD             ~3000 (Write)

·         Write Throughput (I/O/sec) The average number of host write requests that is passed through the LUN per second. Smaller requests usually result in a higher write throughput than larger requests. When troubleshooting specific LUNs, check the write IO size and see if the size is what you would expect for the application you are investigating. Extremely large IO sizes coupled with high IOPS may cause write cache contention.

·         Read Throughput (I/O/sec) The average number of host read requests that is passed through the LUN per second. Smaller requests usually result in a higher read throughput than larger requests.

·         Total Bandwidth (MB/s) The average amount of host data in Mbytes that is passed through the LUN per second. This includes both read and write requests. Larger requests usually result in a higher total bandwidth than smaller requests.

·         Read Bandwidth (MB/s) The average amount of host read data in Mbytes that is passed through the LUN per second. Larger requests usually result in a higher bandwidth than smaller requests.

·         Write Bandwidth (MB/s) The average amount of host write data in Mbytes that is passed through the LUN per second. Larger requests usually result in a higher bandwidth than smaller requests. Keep in mind that writes consume many more array resources than reads.

·         Read Size (KB) The average read request size in Kbytes seen by the LUN. This number indicates whether the overall read workload is oriented more toward throughput (I/Os per second) or bandwidth (Mbytes/second). For a finer distinction of I/O sizes, use an IO Size Distribution chart for this LUN.

·         Write Size (KB) The average write request size in Kbytes seen by the LUN. This number indicates whether the overall write workload is oriented more toward throughput (I/Os per second) or bandwidth (Mbytes/second). For a finer distinction of I/O sizes, use an IO Size Distribution chart for the LUNs.

Below is an explanation of additional performance metrics that I don’t use as frequently, but I’m including them for completeness.

·         Forced Flushes/s Number of times per second the cache had to flush pages to disk to free up space for incoming write requests. Forced flushes are a measure of how often write requests will have to wait for disk I/O rather than be satisfied by an empty slot in the write cache. In most well performing systems this should be zero most of the time.

·         Full Stripe Writes/s Average number of write requests per second that spanned a whole stripe (all disks in a LUN). This metric is applicable only to LUNs that are part of a RAID5 or RAID3 group.

·         Used Prefetches (%) The percentage of prefetched data in the read cache that was read during the last polling interval.

·         Disk Crossing (%) Percentage of host requests that require I/O to at least two disks compared to the total number of host requests. A single disk crossing can involve more than two disk drives.

·         Disk Crossings/s Number of times per second that a request requires access to at least two disk drives. A single disk crossing can involve more than two disks.

·         Read Cache Hits/s Average number of read requests per second that were satisfied by either read or write cache without requiring any disk access. A read cache hit occurs when recently accessed data is re-referenced while it is still in the cache.

·         Read Cache Misses/s Average number of read requests per second that did require one or more disk accesses.

·         Reads From Write Cache/s Average number of read requests per second that were satisfied by write cache only. Reads from write cache occur when recently written data is read again while it is still in the write cache. This is a subset of read cache hits which includes requests satisfied by either the write or the read cache.

·         Reads From Read Cache/s Average number of read requests per second that were satisfied by the read cache only. Reads from read cache occur when data that has been recently read or prefetched is re-read while it is still in the read cache. This is a subset of read cache hits which includes requests satisfied by either the write or the read cache.

·         Read Cache Hit Ratio The fraction of read requests served from both read and write caches vs. the total number of read requests. A higher ratio indicates better read performance.

·         Write Cache Hits/s Average number of write requests per second that were satisfied by the write cache without requiring any disk access. Write requests that are not write cache hits are referred to as write cache misses.

·         Write Cache Misses/s Average number of write requests per second that did require one or multiple disk accesses. Write requests that cause forced flushes or that bypass the write cache due to their size are examples of write cache misses.

·         Write Cache Rehits/s Average number of write requests per second that were satisfied by the write cache since they had been referenced before and not yet flushed to the disks. Write cache rehits occur when recently accessed data is referenced again while it is still in the write cache. This is a subset of Write Cache Hits.

·         Write Cache Hit Ratio The ratio of write requests that the write cache satisfied without requiring any disk access vs. the total number of write requests to this LUN. A higher ratio indicates better write performance.

·         Write Cache Rehit Ratio The ratio of write requests that the write cache satisfied since they have been referenced before and not yet flushed to the disks vs. the total number of write requests to this LUN. This is a measure of how often the write cache succeeded in eliminating a write operation to disk. While improving the rehit ratio is useful it is more beneficial to reduce the number of forced flushes